Internet World Map 2007
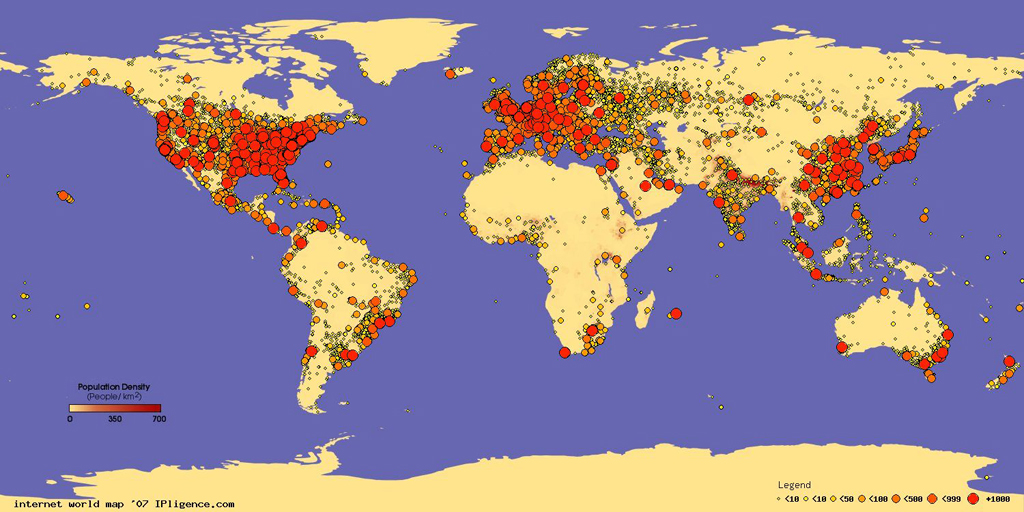
This study shows how the Internet is distributed across the entire world, as it can be appreciated at a first sight, North America and Europe concentrate the two largest groups of Internet assets with a total share of 22.5% for Europe and doubling this number 55.9% for North America.
Therefore it can be said that both regions represent a total 77.4% of the global Internet structure having Asia being the next one in the list with a share of 14%. The image bellow uses colored dots to represent the distribution and is expressed in number of IP addresses per dot.
Breakdown by geographic IP location
| Geographic area | Number of addresses | Percentage |
|---|---|---|
| Africa | 40241664 | 1.519% |
| Antartica | 15620 | 0.001% |
| Asia | 371297015 | 14.015% |
| Caribbean | 1681866 | 0.063% |
| Central America | 2557340 | 0.097% |
| Europe | 569838903 | 21.510% |
| Middle East | 12011131 | 0.453% |
| North America | 1481754661 | 55.932% |
| Oceania | 76417711 | 2.885% |
| South America | 93409304 | 3.525% |
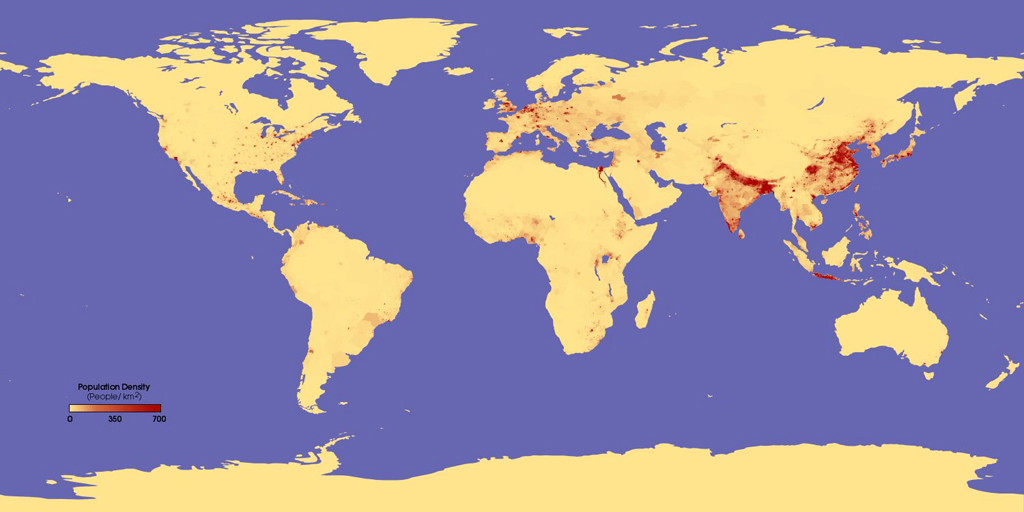
To compare how the Internet world compares with the human populated world this image bellow shows the number of people per square kilometer around the world. The data were derived from population records based on political divisions such as states, provinces, and counties. Because the resolution of the data from different nations varies, some small areas with high populations (such as Rio de Janeiro, Brazil) appear to have moderate population density spread over large areas.
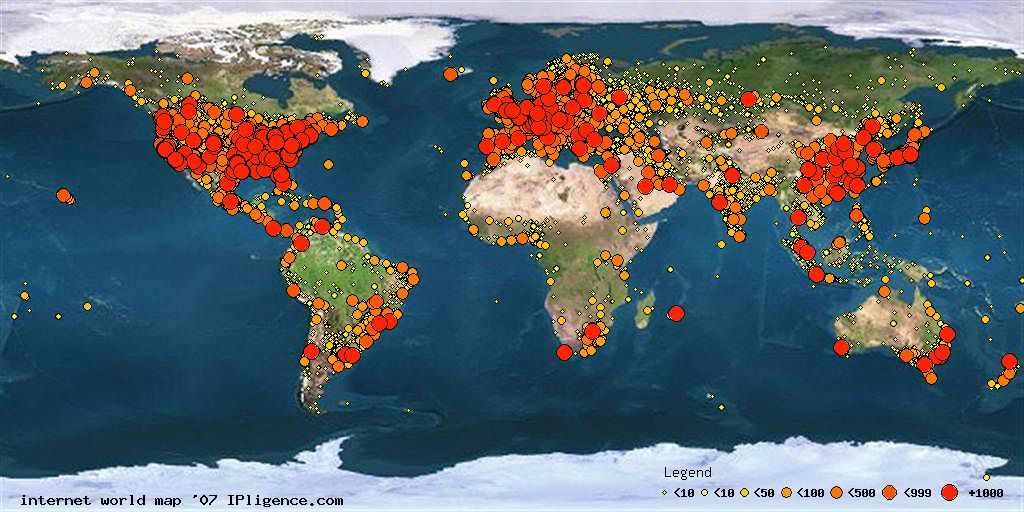
This is how both combine together, its easy to see how super populated areas such regions of Africa, India and China still are behind in Internet adoption with Africa and Asia having only an estimated 4% and 10% of Internet penetration compared to the 70% penetration in United States: